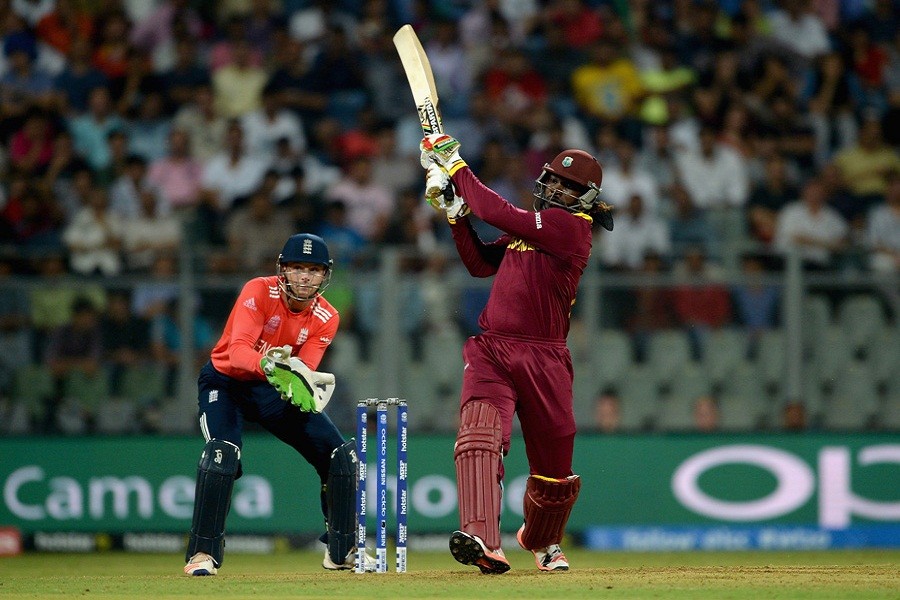
Powerplay rules were included in the limited-over games to make it more interesting, to let the batsmen become more intent and give a chance to spectate a more competitive bat and ball game.
In an era where the batsmen have become more dominant than ever, powerplay plays a key role in deciding the game.
Giving a headstart always gives the batting team the natural boost of confidence they need.
Here, we will look into teams’ performance in the powerplay overs in T20 cricket. It’s mentionable that only two fielders are allowed outside the 30-yard circle in T20I since the last T20 world cup.
The following lists include only test playing nations and their performance against test playing nations. As Afghanistan and Ireland earned their test status in June 2017, the numbers are counted for the performances since July 2017 to give them a fairground.
Highest scores
- Windies- 98/4 vs Srilanka, March 2021
- Ireland- 93/0 vs Windies, January 2020
- Australia- 91/0 vs New Zealand, February 2018
- India- 78/2 vs South Africa, February 2018
- New Zealand- 77/0 vs England, March 2018
- Sri Lanka- 75/2 vs India, March 2018
- Bangladesh- 74/1 vs Sri Lanka, March 2018
- England- 73/0 vs Australia, July 2018
- Afghanistan- 71/0 vs Ireland, August 2018
- Pakistan- 70/1 vs South Africa, February 2019
- South Africa- 69/0 vs England, February 2020
South Africa- 69/0 vs Windies, July 2021 - Zimbabwe- 63/1 vs Bangladesh, July 2021
Such dominance of Windies here is not at all surprising. A top-order that consists of hitters like Lewis, Gayle, Simmons and Pooran should not be expected anything less. Australia and Ireland ones were also impressive. However, let’s dig deeper to understand who are the better powerplay side.
Teams scoring the most runs in the powerplay
- India- 2870 runs, 58 innings
- Australia- 2372 runs, 49 innings
- Pakistan- 2321 runs, 52 innings
- New Zealand- 2318 runs, 50 innings
- Windies- 2302 runs, 47 innings
- England- 2124 runs, 41 innings
- South Africa- 2049 runs, 42 innings
- Bangladesh- 1988 runs, 45 innings
- Sri Lanka- 1798 runs, 39 innings
- Zimbabwe- 1386 runs, 33 innings
- Afghanistan- 1123 runs, 23 innings
- Ireland- 1014 runs, 21 innings
This list might be misleading as the number of matches played plays a key role here.
Highest average
- England- 52.44
- Australia- 49.82
- Windies- 49.5
- India- 49.48
- South Africa- 49.37
- Ireland- 49.06
- Afghanistan- 48.83
- New Zealand- 47.31
- Sri Lanka- 46.1
- Bangladesh- 44.67
- Pakistan- 44.63
- Zimbabwe- 42
This might give a more accurate picture of every team’s powerplay performances. England with Jason Roy, Joss Butter, Jonny Bairstow and David Malan on the top no wonder produced the most powerful powerplays.
Australia and the Windies also fared well. Whereas it’s disappointing to see teams like New Zealand and Pakistan with such massive top orders being so down on the list.
Also, sub-continent sides, bar India, should be concerned about their inconsistent and comparably low productivity from the powerplay. These powerplay stats from the last 4 years do not construct an encouraging picture for Bangladesh either.
Again, these are plain numbers, doesn’t explain pitch conditions, opponents and other stuff. However, teams with solid powerplay stats will be benefitted from their consistency for sure.


